
Analysis of C films on Si.
I frequently need to coat samples for X-ray Energy Dispersive Spectroscopy (EDS) with carbon to obtain a conductive surface so that the specimen does not charge in the scanning electron microscope (SEM).
Especially when we run the analysis at low acceleration voltages, the carbon coating can attenuate the emitted X-rays, especially the low energy ones. I need a way to estimate the thickness of the C layer. Our vacuum evaporator does not have a thickness monitor located near the specimen. I realized that it is easy to add a small chip of conductive silicon to the sample stub prior to coating with C. I can then add an uncoated chip to the stub and measure the EDS spectrum for each.
I decided to write Python scripts to run Monte Carlo simulations of the spectra using the NIST DTSA-II Jupiter software and to process the data to extract the peak integrals. My plan was to use R to script the data reduction and analysis.
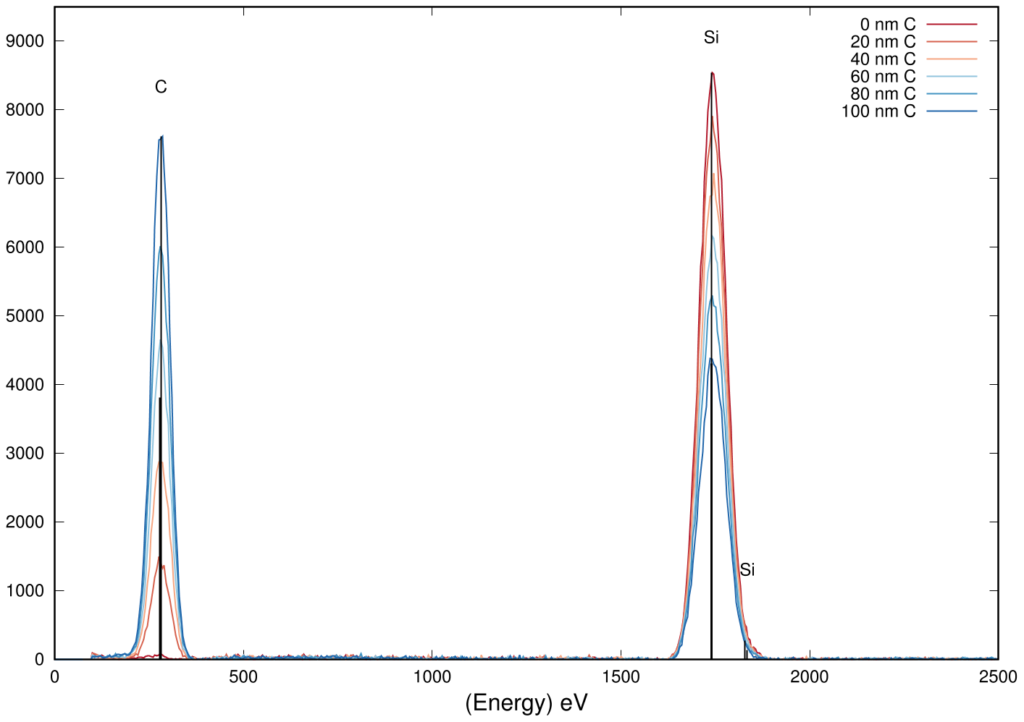
Six of the resulting spectra, after subtraction of the continuum,are shown below. These were exported from DTSA-II as gnuplot plot files.
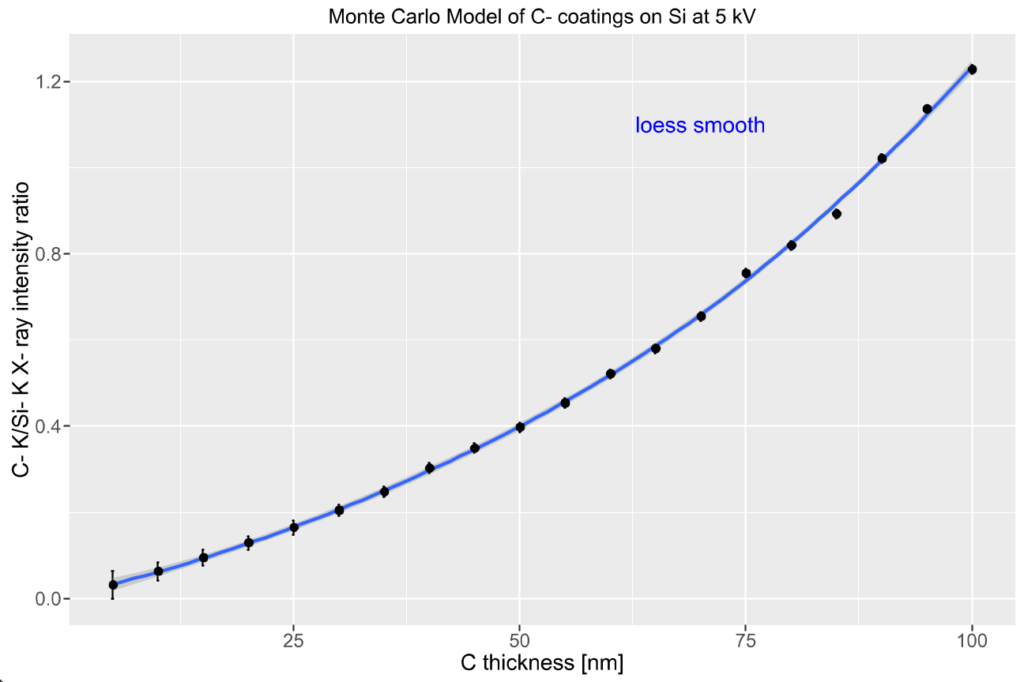
The script also computed the peak integrals, outputting the integral and an estimate of the uncertainty to a .csv file. I then used R to analyze the data (computed at 5 nm increments, even though the plots are at 20 nm increments). I computed a smooth curve using the LOESS algorithm. The predicted values may be used as a lookup table.
All the code is in my dtsa2Scripts repository.